Berhault Benjamin
I build the data layer people still trust eighteen months later
ODS · SSIS · CDC Kafka/Debezium · SQL Server · PostgreSQL + production LLM, MCP and vector pipelines ICRC · City of Lausanne · Paris Fire Brigade
Data integration and warehousing engineer. I build the layer between operational systems and the people who have to decide on them: Operational Data Stores, ETL/ELT pipelines, CDC replication, enterprise data warehouses — and, for the last two years, the LLM and vector layer on top of them. Ten years of it in places where a broken flow has consequences: emergency services, humanitarian operations, government.

Achievements
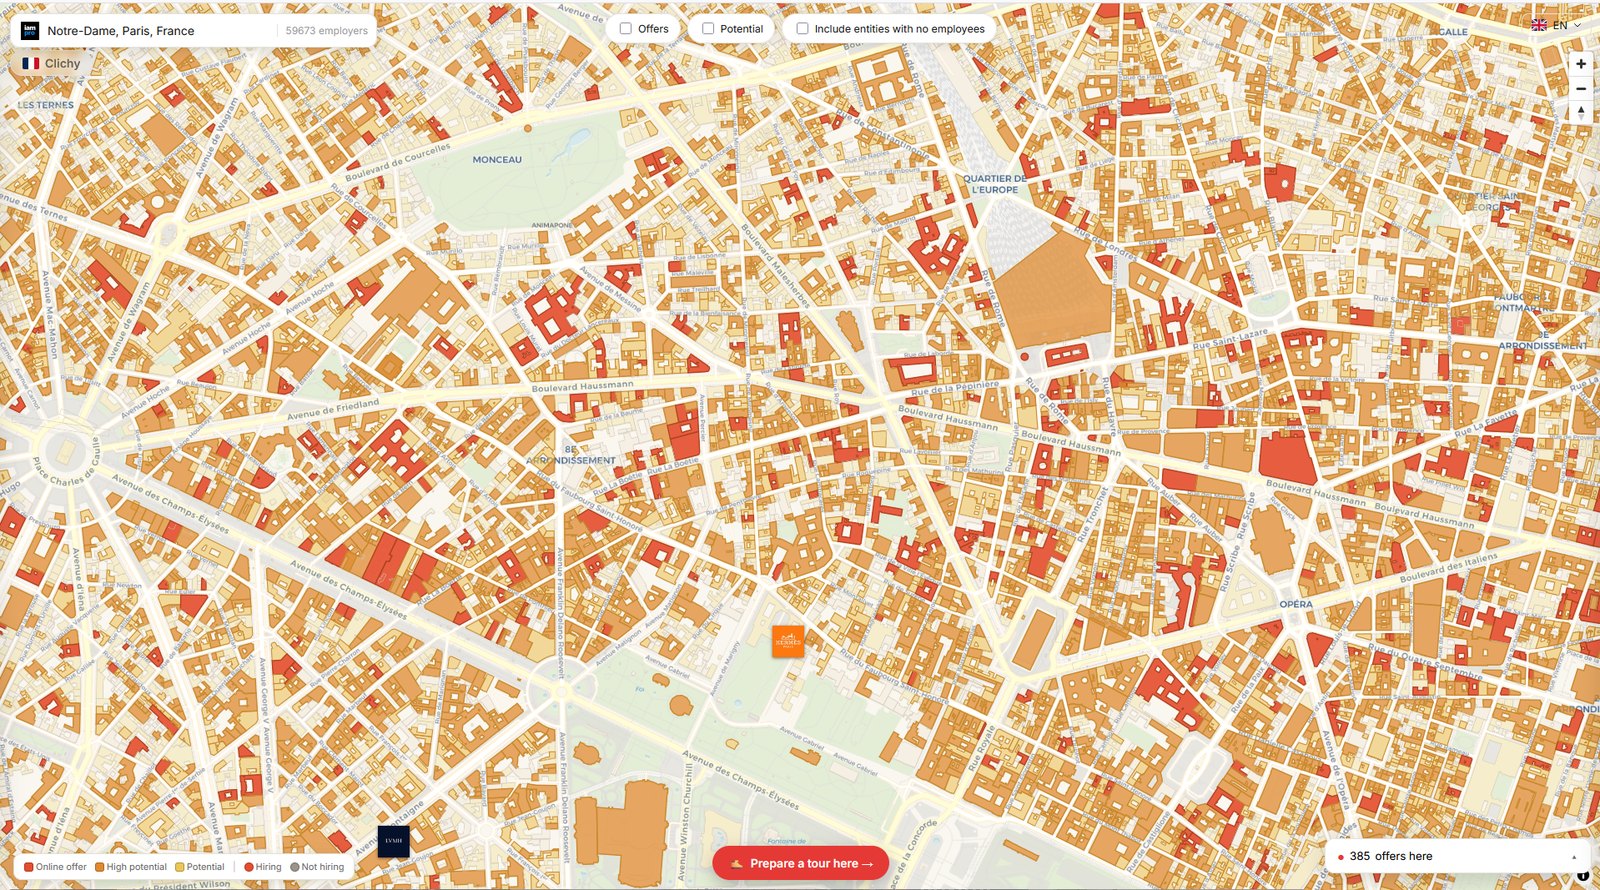
- Built a 20-country job platform solo — ingestion, matching, salary data and a 40M-establishment employer map
- Enterprise data warehouse fed from a 250-system application landscape (Paris Fire Brigade)
- Data integration for ICRC humanitarian programmes across 90+ countries (CRM Dynamics)
- CDC replication platform with four operating modes and its own monitoring stack (City of Lausanne)
- Designed an agent-native write surface — 50+ MCP tools over real career data, every mutation reversible
- Building-level emergency coverage engine — 3.3M buildings, GPU-accelerated, 5 cities
- Reconstructed call load and on-duty skills from raw switch logs — fine grain to multi-year zoom, for France's largest emergency call platform
- Took a fire brigade's response-time problem to the Collège de France and an ENS Paris data challenge
- Automated FX research pipeline — 16 years of tick data, walk-forward validation, 5 services running unattended
Built a 20-country job platform solo — ingestion, matching, salary data and a 40M-establishment employer map
Job platforms optimize for engagement, not outcomes: stale recycled listings, missing salaries, keyword-overlap "matching". A candidate's four honest questions — is it still open, does it fit me, what does it pay, who's hiring near me — turned out to be a full data-engineering problem.
Sources
What I did
Built a multi-service platform solo: job ingestion across 20 countries with dedup and liveness re-confirmation, a 3-layer salary engine (official statistics + LLM extraction with per-country quality canaries + geographic ML fallback), a 40M-establishment employer map served from a millisecond read-model, and an agent-native MCP server with safe, reversible write-tools.
Why This Approach
Ranking favours verifiably-open jobs over recently-scraped ones — the liveness layer re-confirms postings against their source, because correct-but-slower beats fast-but-stale when a candidate is deciding where to spend an application. And rather than chasing every feature myself, the platform is agent-native: it exposes its write surface to the user's own Claude, ChatGPT or Grok. That decision is big enough to carry its own proof card on this page — the MCP write surface, below.
Challenges
The employer map was the expensive lesson. The naive version scanned 44.9M rows per viewport and died in 502s under any real use. I spent a week trying to make the scan fast before accepting that the correct answer was a boring precomputed read-model table, which answers the same question in milliseconds.
What I Learned
To treat my own job search as the test bench. I am the platform's heaviest user, which is what keeps the roadmap honest: a feature that does not help me find work does not survive contact with a Monday morning.
What I Was Wrong About
I over-engineered the first version into microservices, then collapsed it back to a modular monolith. Pre-product-market-fit, shipping speed beats architectural purity — and a service boundary you drew before you understood the domain is a cost you pay on every change.
20 countries · 40M+ establishments · 1,450+ tests
Enterprise data warehouse fed from a 250-system application landscape (Paris Fire Brigade)
The brigade's digital transformation plan called for it to become data-driven, but its operational and management data sat scattered across an application landscape of some 250 information systems, with no common ground on which to analyse rescue activity, staffing and equipment together.
Sources
- ENS Paris — Challenge Data #21, the open benchmark built from this warehouse (219,337 train / 108,033 test records) — challengedata.ens.fr
- Dataset documentation — the operational fields consolidated for the release — paris-fire-brigade.github.io
What I did
Set up the enterprise data warehouse and designed and built the ETL flows feeding it from that landscape — emergency interventions, human resources, working-time management, medical records, electrocardiograms, stock and equipment. On my own initiative, added a set of internal indicators monitoring the warehouse loading jobs so failures surfaced as anomalies to be cleared rather than as silent gaps, and wrote the internal BI wiki that onboarded newcomers to the practice. Ran requirement-gathering interviews with the business units, and mentored apprentices on delegated projects.
~250 source information systems · 7+ data domains · 8,500+ personnel
Data integration for ICRC humanitarian programmes across 90+ countries (CRM Dynamics)
The ICRC was moving critical humanitarian programmes onto Microsoft CRM Dynamics — tracking missing persons and human remains, family visits to detainees, and objectives shared across Red Cross structures. Each migration carried highly sensitive personal data about people whose safety depends on it being handled correctly, and none of the programmes could pause while the data moved.
Sources
What I did
As part of the ICRC data-integration team, built and operated the SSIS pipelines behind three programme migrations — Resolve (missing persons and human remains), the Family Visit Program (family visits to detainees) and Red Loop (objectives, indicators, programmes and agreements shared across Red Cross structures) — integrating the Operational Data Store with CRM Dynamics through the KingswaySoft toolkit. Also carried the whole SSIS estate through two major version upgrades (2016 → 2019 → 2022) in project mode (SSISDB), preserving packages, views, procedures, lookup functions, mapping tables and third-party components.
Why This Approach
Every programme went through the Operational Data Store in both directions — never application to application. Inbound, a programme's data is conformed against the entities the ODS already masters, so a person, a commitment or a structure means the same thing across the estate rather than meaning something local to whichever application produced it. Outbound, the ODS is what feeds CRM Dynamics through KingswaySoft, so the reference version is what the business sees. Wiring each application straight to the CRM would have been faster per migration and would have produced as many versions of the truth as there were programmes — which, on data about missing persons and detainees, is not a reporting inconvenience. Holding the same pattern across all three is what made them one integrated layer instead of three parallel pipes.
Constraints
Highly sensitive personal data under strict handling rules; live humanitarian programmes that could not be paused for a migration; and a legacy SSIS estate spread across several SQL Server versions with third-party components to preserve.
90+ countries · 3 CRM Dynamics programmes
CDC replication platform with four operating modes and its own monitoring stack (City of Lausanne)
The City of Lausanne needed to separate analytics from its operational systems and raise the availability of its municipal data — utility network and worksite-coordination domains, geographic data included — on an open-source stack its own teams could operate, with no vendor lock-in.
Sources
What I did
Defined the architecture and delivered it: Apache Kafka and Debezium in Docker, driven by a GitLab-Runner pipeline with four operating modes — stream (live capture from the PostgreSQL WAL), restore-and-sink (replay a backup into a staging replication database, then stream it onward), sink-only (drain existing topics into a target), and restore-only. Each stream and sink declared in a single configuration file rather than hand-wired. The geographic data broke the chain: the JDBC sink connector had no notion of PostGIS types, so a city whose data is half geographic could not land in the target — I added the missing dialect support, mapping Debezium's Geometry, Geography and Point logical types onto their PostgreSQL counterparts, wrote the unit tests for it, and submitted it upstream to Confluent. Built a custom Prometheus exporter for the CDC system with images published to Artifactory through GitLab CI, a local development stack with test doubles (fake backup endpoint, fake target database, staging replication databases) and a data-growth simulator so behaviour could be validated before touching production, and a database comparison tool that extracts both sides to CSV and reports differences column by column.
Why This Approach
Log-based capture (Debezium on the PostgreSQL WAL) rather than query-based polling: polling misses deletes, drifts under write load and puts read pressure back on the operational database. The restore-and-sink mode exists because a pipeline that simply stops when the WAL is unreachable is not something a city can run on. And the diff tool exists because nobody adopts a replication pipeline they cannot audit — proving the two sides match did more for trust than the streaming architecture itself.
Constraints
Open-source stack only, no managed CDC service. Heterogeneous sources including PostGIS geographic data, and source systems that could not always be tapped live — which is what the four-mode design answers. Multi-environment: several Kafka clusters plus a development cluster, each with its own declared properties.
4 operating modes · several Kafka clusters · 1 upstream PR
Designed an agent-native write surface — 50+ MCP tools over real career data, every mutation reversible
Letting someone's own Claude or ChatGPT write to their live professional record is a different problem from exposing an API. The agent is not deterministic, it cannot be code-reviewed before it acts, and the data it edits — a public profile, a CV, an application log — is the thing the person is judged on. A bad write is not a bug report, it is a recruiter reading something wrong.
Sources
What I did
Built and operate an MCP server exposing 50+ tools over the platform: job search and salary benchmarking, application logging, CV generation against an evidence vault, employer prospecting, and the public showcase. Designed the write path around three rules. Every mutation returns an undo token, so no agent action is terminal. Every write is scoped to the caller's active identity — a lesson learned the hard way after an unscoped profile write let one identity overwrite another. And writes take a lock timeout and release the transaction before any model call, because an await held across an open transaction is how a single slow LLM response takes the whole pool down.
Why This Approach
Reversibility over validation. You can spend forever trying to stop a model from writing something wrong, and you will still lose sometimes; an undo token converts a whole class of unrecoverable failures into a correction. It also changes how the agent behaves — a tool that can be undone can be given real authority, so the user is not asked to approve every field.
Constraints
The agent runs in someone else's client, on someone else's model, with a tool list that client caches and may not refresh. So the server cannot rely on the agent seeing the current tool surface, cannot rely on well-formed arguments, and cannot rely on a retry being safe. Confidentiality is a hard boundary too: the write tools carry an employer-confidentiality guardrail in the tool description itself, because the model drafting a case study is the only thing standing between an NDA and a public page.
Challenges
The sharpest failure was one I caused myself. The showcase write tool accepted 21 fields and the read tool returned four, so any agent editing an existing card was working blind: it could not see what it was about to overwrite, and a partial edit silently dropped the rest. I found it by hitting it — a malformed call wrote raw XML into a public card and left it live for fifteen minutes. The fix was a read tool returning every writable field, plus a test that compares the two field sets and fails the build if a writable field has no read path. The class of bug is closed, not the instance.
What I Learned
That the hard part of agent tooling is not the tools, it is the asymmetry: the model's confidence does not fall when its inputs are incomplete. Give it a partial read and it will write a complete-looking result over the gap. Blind writes are the failure mode to design against, ahead of bad writes.
What I Was Wrong About
I assumed the tool list a client shows is the tool list the server offers. It is not — clients cache it per session, and the protocol's change notification only helps if the client listens. I spent time debugging a server that was working correctly before accepting that the staleness was entirely on the other side, and that the honest answer was to name the domain in the tool descriptions so an agent can find its way even with a stale list.
50+ tools · 21 writable fields on the showcase alone · every mutation reversible
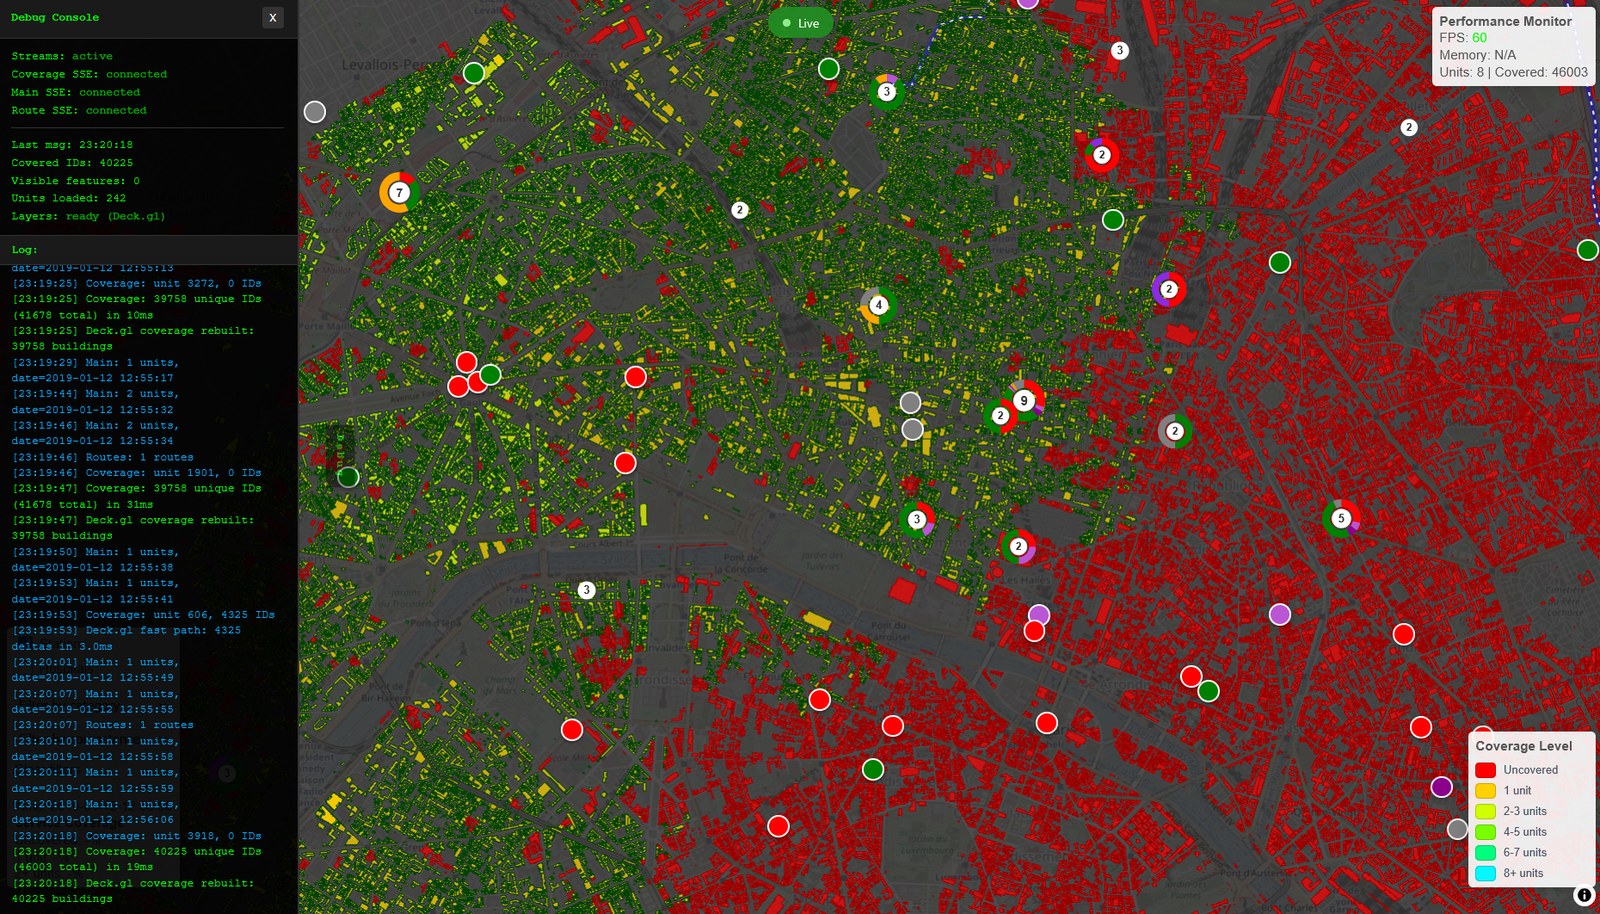
Building-level emergency coverage engine — 3.3M buildings, GPU-accelerated, 5 cities
Emergency dispatchers work from a static sector map — 77 sectors for the whole of Paris — plus their own intuition. Nothing tells them which streets are actually covered right now, or what moving one station would do to coverage. On cardiac arrests, that blind spot is measured in minutes. I first modelled the problem for my CNAM engineering thesis in 2017 and have kept coming back to it since.
Sources
- Source code — routing engine, coverage kernels, streaming path — github.com
- Speaker — Mission Critical Technologies, London Tech Week 2019 — tmt.knect365.com
What I did
Carried the work from a thesis model to a running platform, built entirely solo: an OpenStreetMap preprocessing pipeline that turns any city into a routed graph; a C++17 coverage engine on contraction hierarchies (RoutingKit), with CUDA kernels for the per-building distance thresholding and automatic CPU fallback; a Kafka → C++ → Redis → SSE path for live vehicle positions; MapLibre vector-tile visualisation; and a LightGBM response-time model whose hour-by-hour mobilisation profile drives a dynamic coverage threshold instead of a hardcoded one. Packaged as a multi-city platform with per-city workers and a simulation generator that scales to département-size road graphs.
Why This Approach
Contraction hierarchies (RoutingKit, C++17) because building-level isochrones over a full road network need sub-50ms route queries — no managed service or plain PostGIS routing gets there. CUDA kernels once the per-building CPU loops became the bottleneck, with automatic CPU fallback so the platform still runs on a machine without a GPU. And a deliberately thin streaming path (Kafka → C++ → Redis → SSE) to hold end-to-end latency under a second without heavyweight infrastructure.
Constraints
Solo, unofficial, no budget and no team — nine years of intermittent work around day jobs. A département-size road graph has to be re-scored every time a vehicle moves, in real time, and the same pipeline had to stand up on any city from OpenStreetMap alone, with no vendor data licence.
Challenges
Scaling from 77 sectors to per-building coverage without exploding compute — the answer was moving the hot loop onto the GPU, not buying more CPU. Keeping a live position stream reliable at fleet scale. Making the pipeline city-agnostic so a new city is a data run, not a rewrite. And carrying an unofficial project far enough to be taken seriously — it ended up presented at London Tech Week.
What I Learned
A working real-time demo opens more doors than any report — and the data structure (contraction hierarchies) mattered far more than the hardware, right up until it didn't and the GPU became the answer. Nine years on the same question also taught me the difference between a problem I keep returning to and a problem I have finished: this one is still the former.
3.3M buildings · 464k road segments · 5 cities
Reconstructed call load and on-duty skills from raw switch logs — fine grain to multi-year zoom, for France's largest emergency call platform
The platform answers 17, 18 and 112 for Paris and three surrounding departments. Its telephone switch emitted technical equipment messages, not business events: nobody could see call load over time, nor how many operators were actually present for each emergency number. Attempts before mine had not produced a usable series, so planning and after-the-fact analysis ran on estimates.
Sources
- Marin Boyet, PhD thesis, École polytechnique / INRIA, defended 25 May 2022 — names me in the acknowledgements for the extraction of the PFAU telephony data — theses.hal.science
- Allamigeon, Boyet, Gaubert — Computing Transience Bounds of Emergency Call Centers (Springer, 2022), from the same research programme — link.springer.com
What I did
Transcribed the switch's technical message stream into business facts through three preprocessing layers: raw equipment events, then calls reconstituted from the sequences of messages that describe them, then call load and operator presence resolved per emergency number. Loaded in SSIS onto the warehouse. Because no interactive chart can be driven from raw rows across years, I pre-aggregated every measure at several time grains and served the grain the viewport asks for rather than the underlying events — the pattern behind a lazy-loading stock chart, applied to emergency telephony.
Why This Approach
Raw events cannot drive an interactive chart across years: the point count defeats the wire and the browser before it defeats the database. Pre-aggregating at several grains and picking the grain by zoom level moves the cost from every render to one load, which is what makes the zoom feel instant. And the business facts had to be materialised rather than computed on read — a query that stitches a call back together from equipment messages every time it runs is a query nobody runs twice.
Constraints
Emergency telephony data, on a platform run jointly by two services under police authority — every extract had to be defensible on scope and confidentiality. The source was a proprietary Alcatel switchboard with a ticket extractor, not a database designed to be queried; the reference data the tickets pointed at did not exist anywhere as a governed model, which is why Master Data Services came before reporting rather than after.
Challenges
The switch describes equipment, not service. A call is not one message but a sequence to be stitched, with the awkward cases at the edges: transfers, abandons, re-presentations. Operator presence is harder still — "present for 18" is a state to be inferred from logins and skill assignments over time, not a field that exists anywhere in the source. Others had attempted this before me without landing a usable series, which is the honest reason it counted as a result rather than a report.
What I Learned
That the real test of a data warehouse is not whether it feeds your own dashboards — it is whether someone outside your organisation, with no access to your context, can build on it and reach conclusions they will defend in public. A doctoral jury reviewing analysis run on my extracts is a harsher audit than any internal review I ever went through, and it is the one that told me the model was sound.
811,429 calls · 3 emergency numbers · Paris + 3 departments
Took a fire brigade's response-time problem to the Collège de France and an ENS Paris data challenge
Predicting how long a rescue vehicle will take to arrive is the factor emergency services have least visibility on, and the brigade held years of dispatch history nobody outside had ever modelled. The research capacity to attack it existed — in academia and industry, not inside the institution.
Sources
- Stéphane Mallat, « Sciences des données », L'annuaire du Collège de France vol. 120 (2023), p. 27-36 — names the challenge and me as its presenter (DOI 10.4000/annuaire-cdf.18077) — journals.openedition.org
- The challenge, live on ENS Paris Challenge Data — challengedata.ens.fr
- The dataset and challenge documentation I wrote — paris-fire-brigade.github.io
- The reference solution I published as the baseline — github.com
- Speaker — Mission Critical Technologies, London Tech Week 2019 — tmt.knect365.com
What I did
Framed the problem as an open data challenge with ENS Paris. Turned the brigade's operational dispatch history into a documented public dataset — 219,337 training and 108,033 test records covering intervention details, vehicle status before selection, GPS tracks and routing estimates — specified three prediction targets (alert to departure, departure to arrival, and the combined response time), and wrote the challenge documentation. Then took the modelling the entrants had shared — the credit for it is theirs and it is on the repository's front page — and did the part they had no reason to do: consolidated it and put it behind an API, so that instead of a batch procedure run offline it answers for several vehicles on demand. Presented the work at the Collège de France, in Stéphane Mallat's Data Sciences chair seminar, and to an industry audience at Mission Critical Technologies during London Tech Week 2019.
What I Learned
Getting an emergency service to open its operational data to outside researchers was harder than any modelling problem in it. And the most useful thing I contributed was not a model — the entrants beat my baseline, which is what a well-posed challenge is for. It was moving the winning approach out of a batch script and behind an API: not perfect, but far enough along that the work became testable in real conditions by anyone who wanted to. That is usually the step between an interesting result and something a service can actually use.
219k training records · 3 prediction targets
Automated FX research pipeline — 16 years of tick data, walk-forward validation, 5 services running unattended
I wanted to test whether a statistically validated trading edge could be found and operated as a pure data-engineering problem rather than a discretionary one. The hard part is not the strategy — it is building an evaluation harness honest enough that you can believe its output, on a dataset where look-ahead bias silently manufactures profit.
What I did
Built a 5-service Docker architecture: hourly ingestion of Dukascopy price data, macro signal aggregation (FRED, ECB, SNB, COT positioning, VIX), tree-based regime detection (RandomForest, XGBoost, CatBoost), and paper-trade execution with adaptive threshold tuning. The core is a walk-forward backtesting framework over 16 years of hourly data — roughly 120k candles per pair across 8 pairs — built specifically to make look-ahead bias impossible rather than merely unlikely. Cron-driven cycles with structured error reporting and heartbeat monitoring to a central hub, plus a FastAPI dashboard for signals and balances.
Why This Approach
Walk-forward validation rather than a single train/test split, because on financial time series a static split flatters any model that has seen the future. Tree-based models over neural networks because the feature set is small, engineered and macro-driven — the regime signal is in the features, not in sequence depth.
Constraints
GPU-based deep learning (LSTM) was explored but simpler tree-based models with engineered macro features consistently outperformed it on this problem. Paper trading only — the goal was a validated research pipeline, not a funded book.
What I Learned
Adding complexity consistently degraded out-of-sample performance. The real edge was data-engineering discipline: refusing look-ahead bias, honest walk-forward validation, and adaptive tuning — not model sophistication. It is the clearest example I have of a negative result being the useful result.
16 years of data · 8 currency pairs · 5 services
About
What I care about is whether people still trust the numbers eighteen months later. Most of what I build that nobody asked for — load monitoring, source/target diffs, written practice — is aimed at that. At the Paris Fire Brigade I led the data team that ran the warehouse, including former firefighters retraining into technical roles, and became the institution's internal referent on the Microsoft BI stack. The ICRC, Lausanne and Brigade engagements are documented in the proof cards above, each with links you can check yourself — so they are not repeated here. Core stack: SQL (T-SQL, PL/pgSQL), SSIS, SQL Server, PostgreSQL/PostGIS, Python (8+ yrs), Apache Kafka, Debezium, Microsoft CRM Dynamics, KingswaySoft, Master Data Services, Power BI, Docker, GitLab CI/CD, Linux. AI: LLM integration (Claude, GPT, Gemini, Grok, DeepSeek), model routing and cost control, MCP, embeddings and pgvector. Also: dbt, Snowflake, Databricks, Spark, FastAPI, Redis, C++/CUDA. Former Paris firefighter — seven years operational before teaching myself to code and earning a CNAM engineering degree. That background is why I build for the case where the system is degraded, not only for the happy path. Based in Annecy, France. Open to permanent roles and freelance missions — on-site in Haute-Savoie / Geneva, hybrid, or remote. French native, professional English.
Technical Expertise
Proven in the work above
Proven by experience
Also worked with
Timeline
Independent Data Engineer / Data Consultant · Unknown
Python · FastAPI · PostgreSQL · pgvector · Redis · Docker · GitLab CI/CD · Linux
- Multi-source ingestion chain — 54 declared sources with daily indexing and health telemetry
- Production data infrastructure deployed on dedicated servers (Hetzner)
- AI-powered matching platform (web, mobile and automated agent)
Data Consultant — Proof of Concept, energy sector · Energy-sector client (unnamed) via Talan SA
Azure Databricks · Apache Spark · Kafka · GitLab CI/CD · Portainer · Snowflake
- PoC data pipeline with Azure Databricks and Apache Spark for the energy sector
Data Consultant — CDC / Data Replication Engineer · City of Lausanne (SOI/SIL), Switzerland via Talan SA
Apache Kafka · Debezium · Docker · Python · GitLab CI/CD · PostgreSQL · PostGIS · MinIO
Read the story arrow_forwardData Consultant — Data Integration Engineer · ICRC — International Committee of the Red Cross via Talan SA
SSIS · SQL Server · Microsoft CRM Dynamics · KingswaySoft · Azure DevOps · Team Foundation Server · Git · T-SQL
- Data integration for ICRC humanitarian programmes across 90+ countries (CRM Dynamics)
- Data migration for Resolve — missing persons and human remains management (CRM Dynamics)
- Data migration for Family Visit Program — management of Palestinian prisoner family visits
Data Architect · Paris Fire Brigade (BSPP)
SQL Server · SSIS · Power BI · PostgreSQL · MySQL · Apache Kafka · Redis · Python
- Enterprise data warehouse fed from a 250-system application landscape (Paris Fire Brigade)
- Launched the DS4ES open-source initiative — data science for emergency services
- Led the data team running the warehouse — including former firefighters retraining into technical roles
Data Warehouse Developer / BI Developer · Paris Fire Brigade (BSPP)
SQL Server · SSIS · Power BI · Master Data Services · JavaScript · Python · PowerShell · Bash
- Reconstructed call load and on-duty skills from raw switch logs — fine grain to multi-year zoom, for France's largest emergency call platform
- Data challenge launched with ENS Paris on emergency unit response time prediction
- Governed the telephony reference data with Master Data Services before any report was built on it
IT / BI Assistant · Paris Fire Brigade (BSPP)
SQL Server · Power BI · Power Query · Python · T-SQL
- Modelled an optimal resource deployment system for emergency services (engineering thesis)
- Supported the warehousing and analytics programme of the steering, audit and control office, reporting to the brigade's high command
Education & certifications
Certifications
Let's talk.
Available immediately
Message sent — you'll get a reply by email.
 iampro.io
This page was built with iampro.io
Show what you have really done.
Import your CV and iampro.io turns it into a page like this one — then finds the jobs that match it and keeps track of everything you send.
Build my page arrow_forward